Hierarchy
From GersteinInfo
| Line 76: | Line 76: | ||
[http://archive.gersteinlab.org/proj/Hierarchy_Rewiring/Yeast_changes_hier_Costanzo_et_al.xls Yeast gene deletion] from Synthetic array by Costanzo et al. | [http://archive.gersteinlab.org/proj/Hierarchy_Rewiring/Yeast_changes_hier_Costanzo_et_al.xls Yeast gene deletion] from Synthetic array by Costanzo et al. | ||
Columns are as follows: | Columns are as follows: | ||
| + | |||
Column 1: Deleted1: first gene deleted. | Column 1: Deleted1: first gene deleted. | ||
| + | |||
Column 2: Deleted2: second gene deleted. | Column 2: Deleted2: second gene deleted. | ||
| + | |||
Column 3: level1: first gene's position in the wild-type hierarchy. Bottom=Level 1. First = Level 2. Two = Level 3. Three = Level 4. | Column 3: level1: first gene's position in the wild-type hierarchy. Bottom=Level 1. First = Level 2. Two = Level 3. Three = Level 4. | ||
| + | |||
Column 3: level2: second gene's position in the wild-type hierarchy. Bottom=Level 1. First = Level 2. Two = Level 3. Three = Level 4. | Column 3: level2: second gene's position in the wild-type hierarchy. Bottom=Level 1. First = Level 2. Two = Level 3. Three = Level 4. | ||
| + | |||
Column 5: P-value: P-value of the genetic interaction between them. | Column 5: P-value: P-value of the genetic interaction between them. | ||
| + | |||
Column 6: Pheno: cell growth upon deletion of that pair. | Column 6: Pheno: cell growth upon deletion of that pair. | ||
| + | |||
Column 7: Changes: the number of changes in the hierarchy upon deletion of that pair. | Column 7: Changes: the number of changes in the hierarchy upon deletion of that pair. | ||
| + | |||
The next set of 3 columns are as follows (empty if the number of changes =0): | The next set of 3 columns are as follows (empty if the number of changes =0): | ||
| + | |||
Column 8, 11, 14 etc: Gene_moved: gene that moved its position in the hierarchy. | Column 8, 11, 14 etc: Gene_moved: gene that moved its position in the hierarchy. | ||
| + | |||
Column 9, 12, 15 etc: Initial_level: its initial level in the WT hierarchy. | Column 9, 12, 15 etc: Initial_level: its initial level in the WT hierarchy. | ||
| + | |||
Column 10, 13, 16 etc:Final_level: its final position in the rearranged hierarchy. | Column 10, 13, 16 etc:Final_level: its final position in the rearranged hierarchy. | ||
[http://archive.gersteinlab.org/proj/Hierarchy_Rewiring/Ecoli_changes_hier_baba_et_al.xls E. coli gene deletion] from Baba et al. | [http://archive.gersteinlab.org/proj/Hierarchy_Rewiring/Ecoli_changes_hier_baba_et_al.xls E. coli gene deletion] from Baba et al. | ||
| + | |||
Columns are as follows: | Columns are as follows: | ||
| + | |||
Column 1: Delete: the gene deleted | Column 1: Delete: the gene deleted | ||
| + | |||
Column 2: Current_level: the position in the wild-type hierarchy. Bottom=Level 1. First = Level 2. Two = Level 3. Three = Level 4. | Column 2: Current_level: the position in the wild-type hierarchy. Bottom=Level 1. First = Level 2. Two = Level 3. Three = Level 4. | ||
| + | |||
Column 3: Out_TF: the number of TFs it regulates. Equals 0 for all bottom level rgulators. | Column 3: Out_TF: the number of TFs it regulates. Equals 0 for all bottom level rgulators. | ||
| + | |||
Column 4: Out_overall: the total number of targets | Column 4: Out_overall: the total number of targets | ||
| + | |||
Column 5: Colonies: the fraction of colonies that survived. | Column 5: Colonies: the fraction of colonies that survived. | ||
| + | |||
Column 6: Changes: the number of changes in the hierarchy upon deletion of that gene. | Column 6: Changes: the number of changes in the hierarchy upon deletion of that gene. | ||
| + | |||
The next set of 3 columns are as follows: | The next set of 3 columns are as follows: | ||
| + | |||
Column 7, 10, 13 etc: Gene_moved: gene that moved its position in the hierarchy | Column 7, 10, 13 etc: Gene_moved: gene that moved its position in the hierarchy | ||
| + | |||
Column 8, 11, 14 etc: Initial_level: its initial level in the WT hierarchy | Column 8, 11, 14 etc: Initial_level: its initial level in the WT hierarchy | ||
| + | |||
Column 9, 12, 15 etc:Final_level: its final position in the rearranged hierarchy. | Column 9, 12, 15 etc:Final_level: its final position in the rearranged hierarchy. | ||
[http://archive.gersteinlab.org/proj/Hierarchy_Rewiring/Ecoli_changes_hier_Isalan_et_al.xls E. coli edge addition] from Isalan et al. | [http://archive.gersteinlab.org/proj/Hierarchy_Rewiring/Ecoli_changes_hier_Isalan_et_al.xls E. coli edge addition] from Isalan et al. | ||
| + | |||
Columns are as follows: | Columns are as follows: | ||
| + | |||
Column 1: promoter_ORF_pair: the promoter and ORF fused together. This creates a new edge between the regulators of promotor and the ORF. | Column 1: promoter_ORF_pair: the promoter and ORF fused together. This creates a new edge between the regulators of promotor and the ORF. | ||
| + | |||
Column 2: Number of changes: the number of changes in the hierarchy upon addition of that new edge. | Column 2: Number of changes: the number of changes in the hierarchy upon addition of that new edge. | ||
| - | Column 3: l.s.d.: It measures the ‘least square difference’ between the mutant growth and the wild-type growth so a higher value indicates a slower cell growth. | + | |
| + | Column 3: l.s.d.: It measures the ‘least square difference’ between the mutant growth and the wild-type growth so a higher value indicates a slower | ||
| + | cell growth. | ||
| + | |||
Caution: the types of changes in this file are listed above that line. For example | Caution: the types of changes in this file are listed above that line. For example | ||
appY_rpoD 0 1.58E-09 | appY_rpoD 0 1.58E-09 | ||
| + | |||
rpoE first two | rpoE first two | ||
| + | |||
appY_rpoE 1 7.23E-09 | appY_rpoE 1 7.23E-09 | ||
Revision as of 14:18, 5 July 2010
Information page for the article:
by Nitin Bhardwaj, Philip M. Kim and Mark B. Gerstein
Please cite the above article if usage of the following date results in a publication.
Data:
The regulatory network for Yeast and E. coli. The file is in a tab-delimited format with the regulator followed by the target in the same line. For E. coli, the last column also list the type of regulation: "+" for positive, "-" for negative and "+-" for dual regulation.
| Yeast | E. coli | |
|---|---|---|
| Number of regulatory interactions | 12873 | 3123 |
| Number of Regulators | 288 | 143 |
| Number of Targets | 4410 | 1420 |
| Number of Inter-Regulator interactions | 632 | 220 |
Assignment into hierarchies for Yeast and E. coli.
Changes in hierarchies:
Yeast Gene Deletion from Deutschbauer et al. Columns are as follows:
Column 1: Delete: the gene deleted
Column 2: Current_level: the position in the wild-type hierarchy. Bottom=Level 1. First = Level 2. Two = Level 3. Three = Level 4.
Column 3: Out_TF: the number of TFs it regulates. Equals 0 for all bottom level rgulators.
Column 4: Out_overall: the total number of targets
Column 5: In: In-degree, the number of its regulators
Column 6: Het: tag fitness of the heterozygous deletion in ypd
Column 7: Hom: tag fitness of the homozygous deletion in ypd
Column 8: Ave_hom_het: average fitness of the homozygous and heterozygous deletion in ypd
Column 9: Changes: the number of changes in the hierarchy upon deletion of that gene.
The next set of 3 columns are as follows:
Column 10, 13, 16 etc: Gene_moved: gene that moved its position in the hierarchy
Column 11, 14, 17 etc: Initial_level: its initial level in the WT hierarchy
Column 12, 15, 18 etc:Final_level: its final position in the rearranged hierarchy.
Yeast gene deletion from Synthetic array by Costanzo et al. Columns are as follows:
Column 1: Deleted1: first gene deleted.
Column 2: Deleted2: second gene deleted.
Column 3: level1: first gene's position in the wild-type hierarchy. Bottom=Level 1. First = Level 2. Two = Level 3. Three = Level 4.
Column 3: level2: second gene's position in the wild-type hierarchy. Bottom=Level 1. First = Level 2. Two = Level 3. Three = Level 4.
Column 5: P-value: P-value of the genetic interaction between them.
Column 6: Pheno: cell growth upon deletion of that pair.
Column 7: Changes: the number of changes in the hierarchy upon deletion of that pair.
The next set of 3 columns are as follows (empty if the number of changes =0):
Column 8, 11, 14 etc: Gene_moved: gene that moved its position in the hierarchy.
Column 9, 12, 15 etc: Initial_level: its initial level in the WT hierarchy.
Column 10, 13, 16 etc:Final_level: its final position in the rearranged hierarchy.
E. coli gene deletion from Baba et al.
Columns are as follows:
Column 1: Delete: the gene deleted
Column 2: Current_level: the position in the wild-type hierarchy. Bottom=Level 1. First = Level 2. Two = Level 3. Three = Level 4.
Column 3: Out_TF: the number of TFs it regulates. Equals 0 for all bottom level rgulators.
Column 4: Out_overall: the total number of targets
Column 5: Colonies: the fraction of colonies that survived.
Column 6: Changes: the number of changes in the hierarchy upon deletion of that gene.
The next set of 3 columns are as follows:
Column 7, 10, 13 etc: Gene_moved: gene that moved its position in the hierarchy
Column 8, 11, 14 etc: Initial_level: its initial level in the WT hierarchy
Column 9, 12, 15 etc:Final_level: its final position in the rearranged hierarchy.
E. coli edge addition from Isalan et al.
Columns are as follows:
Column 1: promoter_ORF_pair: the promoter and ORF fused together. This creates a new edge between the regulators of promotor and the ORF.
Column 2: Number of changes: the number of changes in the hierarchy upon addition of that new edge.
Column 3: l.s.d.: It measures the ‘least square difference’ between the mutant growth and the wild-type growth so a higher value indicates a slower cell growth.
Caution: the types of changes in this file are listed above that line. For example
appY_rpoD 0 1.58E-09
rpoE first two
appY_rpoE 1 7.23E-09
means that appY_rpoE fusion leads to 1 change which "rpoE changing from level two to level first".
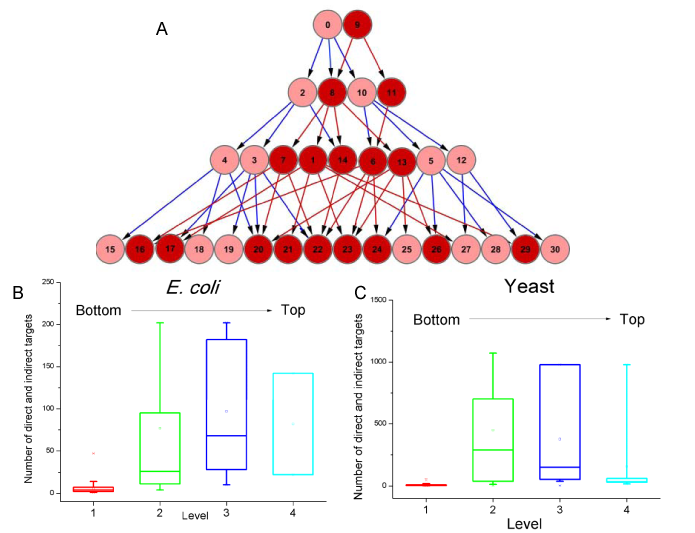
Indirect Targets and Number of targets vs position in the hierarchy (in one of the four levels) for E. coli and Yeast.
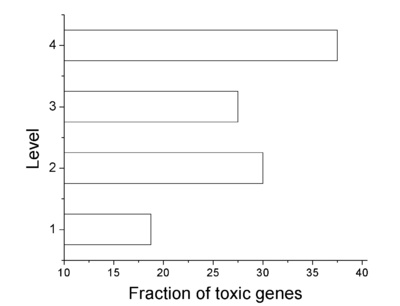
Effects of Overexpression


