ACT
ACT
http://ACT.Gersteinlab.org was developed by Robert Bjornson <robert.bjornson@yale.edu>, Joel Rozowsky, Justin Jee, and others at the Gerstein Lab at Yale.
This code takes an annotation file and one or more signal files, and computes a histogram of the aggregated signal intensity around the annotations.
The annotations should specify an interval on the genome and a strand (direction). The aggregation will be centered around the "beginning" of the annotation, i.e. the 5' end for + strand annotations and the 3' end for - annotations, and oriented as the strand.
Basically, the program lays a set of bins around each annotation, calculates the mean or median signal level in each bin. The final result is the accumulated data for all annotations.
The bins can be laid out in two ways: 1) Fixed size bins. 2*nbins bins, each of length radius/nbins. 2) A fixed number (mbins) of bins of variable size over the annotation proper, with nbins on each size of the annotation.
In the case of snps, we use a binary signal file, with two entries per snp:
SNPloc 1
(SNPloc+1) 0
Figure Legends
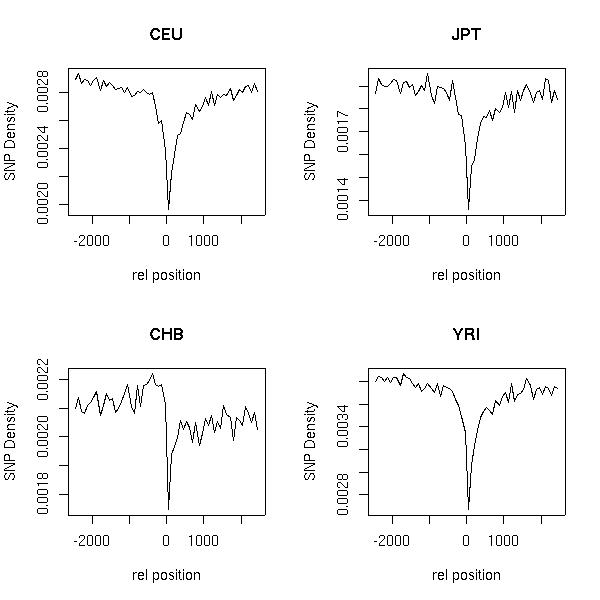
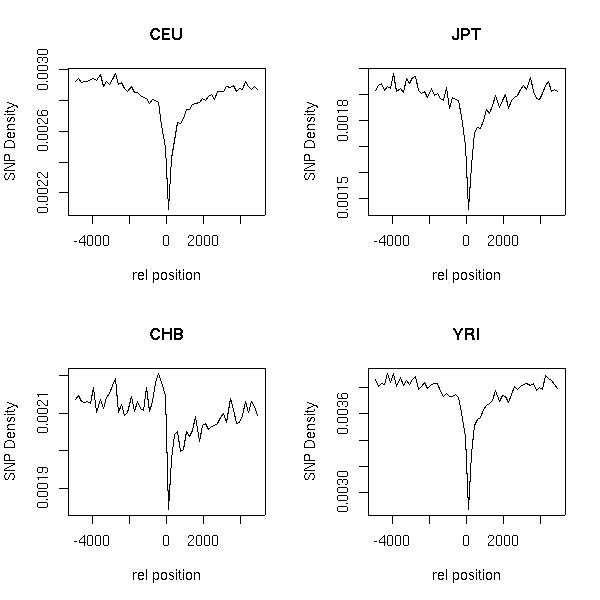
The figures below show the SNP density upstream and downstream of transcription start (TSS) and end site (TSE)respectively. The X- axis shows the relative offset in base-pairs with respect to TSS/TSE. The plot to the left of the origin corresponds to the SNP density upstream of TSS and to the rightof the origin corresponds to SNP density downstream of TES.
These plots were made based on SNPs mapped to GENCODE annotations(GENCODEver2b). These can be obtained from Gencode Release 2B
SNPs are the SNP calls made by Richard Durbin's group and is based on the files obtained from ftp://ftp.sanger.ac.uk/pub/1000genomes/REL-0907
Only high quality SNPs have been used for this calculation (please check the README file that defines the criteria for a high quality SNP).

