FusionSeq Gallery
From GersteinInfo
(Difference between revisions)
| (3 intermediate revisions not shown) | |||
| Line 1: | Line 1: | ||
{{FusionSeqHeader}} | {{FusionSeqHeader}} | ||
| - | + | ==Schematic of FusionSeq== | |
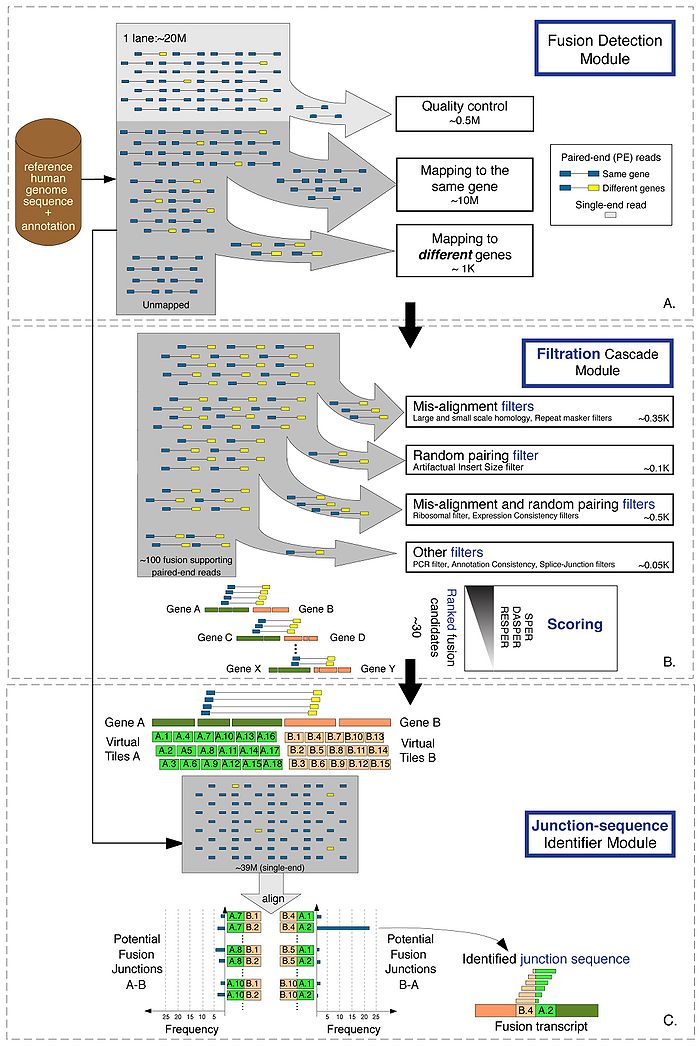
| - | + | * '''A.''' The PE reads are processed to identify potential fusion candidates. Poor quality reads are discarded at first, and the remaining PE reads are aligned to the reference human genome (hg18). The reads are compared to the annotation set (UCSC knownGenes) in order to classify them as belonging to the same gene or to different genes. Those aligned to two different genes are then selected as potential fusion candidates. All good quality single- end reads are also stored for the identification of the sequence of the junction. | |
| - | * B. The filtration cascade module analyzes the candidates and removes those that have high sequence homology between the two genes or a higher insert-size compared to the transcriptome norm. Additional filters are employed to remove candidates due to random pairing and misalignment as well as PCR artifacts and annotation inconsistencies. The high-confidence list of candidates is then scored and processed to find the sequence of the junction. | + | * '''B.''' The filtration cascade module analyzes the candidates and removes those that have high sequence homology between the two genes or a higher insert-size compared to the transcriptome norm. Additional filters are employed to remove candidates due to random pairing and misalignment as well as PCR artifacts and annotation inconsistencies. The high-confidence list of candidates is then scored and processed to find the sequence of the junction. |
| - | * C. The junction-sequence identifier detects the actual sequence at the breakpoints by constructing a fusion junction library. It first covers the regions of the potential breakpoint of each gene with “tiles” 1bp apart, and then creates all possible combinations, considering both orientation of the fusion, namely gene A upstream of gene B and vice versa. All single-end reads are then aligned to the fusion junction library and the junction with the highest support is identified as the sequence of the fusion transcript junction. | + | * '''C.''' The junction-sequence identifier detects the actual sequence at the breakpoints by constructing a fusion junction library. It first covers the regions of the potential breakpoint of each gene with “tiles” 1bp apart, and then creates all possible combinations, considering both orientation of the fusion, namely gene A upstream of gene B and vice versa. All single-end reads are then aligned to the fusion junction library and the junction with the highest support is identified as the sequence of the fusion transcript junction. |
[[File:FusionSeq_schematic.jpg|700px|center]] | [[File:FusionSeq_schematic.jpg|700px|center]] | ||
| + | |||
| + | <center>[[#top|Top]]</center> | ||
| + | |||
| + | ==Results of FusionSeq== | ||
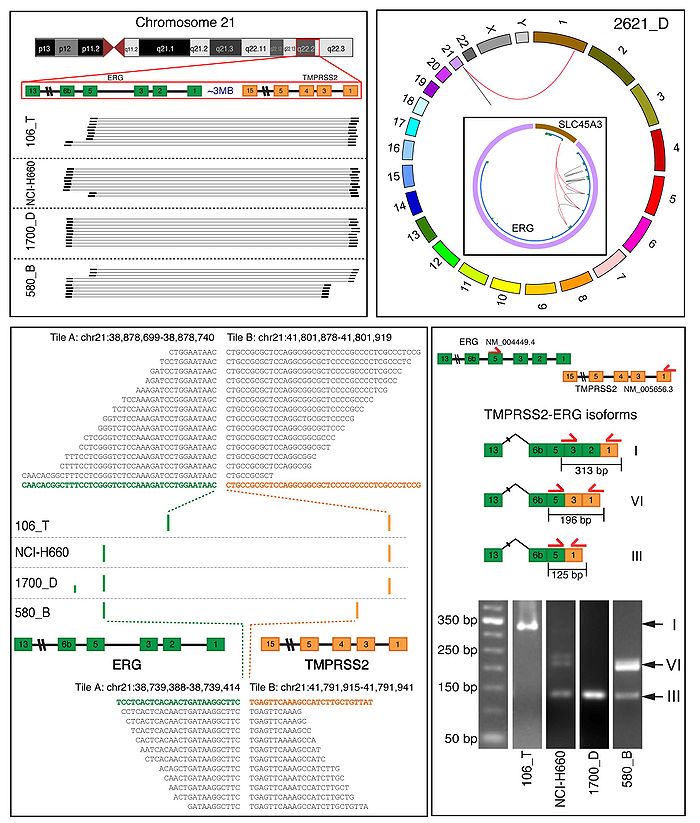
| + | * '''A.''' A subset of the PE reads connecting TMPRSS2 and ERG are shown for 4 samples (106_T, NCI-H660, 1700_D, 580_B). | ||
| + | * '''B.''' PE reads connecting ERG and SLC45A3 for sample 2621_D. The outer circle reports all chromosomes, whereas the inset shows only the region of ERG and SLC45A3. The gray lines depict the intra-transcript PE reads, whereas the red ones represent the inter-transcript PE reads. Note that for illustration purposes, only the inter-transcript reads are shown for SLC45A3. The inset also depicts the composite model (blue line) and its exons (green boxes). | ||
| + | * '''C.''' Results of the junction-sequence identifier. The location of the breakpoints for the 4 samples with the TMPRSS2-ERG fusion are reported as bars (not to scale). Moreover, the sequence of the junctions as well as a subset of the aligned reads for 2 samples is reported (106_T, 580_B). | ||
| + | * '''D.''' The locations of the PCR primers used for the validation are depicted as red arrows. The isoforms consist of TMPRSS2 and ERG exons fused to form different exon combinations as depicted schematically. For both samples NCI-H660 and 1700_D, isoform III is detected, whereas, for samples 106_T and 580_B, isoforms I and VI are determined, respectively. The transcript isoforms were validated by a PCR assay for each sample separately (gel images). A 50 bp length standard (lane 1) is shown here for the determination of the approximate fragment size. The identity of the PCR products was validated by Sanger sequencing. | ||
| + | |||
| + | [[File:FusionSeq_results.jpg|700px|center]] | ||
| + | |||
| + | <center>[[#top|Top]]</center> | ||
Latest revision as of 17:52, 10 September 2010
User documentation main
Schematic of FusionSeq
- A. The PE reads are processed to identify potential fusion candidates. Poor quality reads are discarded at first, and the remaining PE reads are aligned to the reference human genome (hg18). The reads are compared to the annotation set (UCSC knownGenes) in order to classify them as belonging to the same gene or to different genes. Those aligned to two different genes are then selected as potential fusion candidates. All good quality single- end reads are also stored for the identification of the sequence of the junction.
- B. The filtration cascade module analyzes the candidates and removes those that have high sequence homology between the two genes or a higher insert-size compared to the transcriptome norm. Additional filters are employed to remove candidates due to random pairing and misalignment as well as PCR artifacts and annotation inconsistencies. The high-confidence list of candidates is then scored and processed to find the sequence of the junction.
- C. The junction-sequence identifier detects the actual sequence at the breakpoints by constructing a fusion junction library. It first covers the regions of the potential breakpoint of each gene with “tiles” 1bp apart, and then creates all possible combinations, considering both orientation of the fusion, namely gene A upstream of gene B and vice versa. All single-end reads are then aligned to the fusion junction library and the junction with the highest support is identified as the sequence of the fusion transcript junction.
Results of FusionSeq
- A. A subset of the PE reads connecting TMPRSS2 and ERG are shown for 4 samples (106_T, NCI-H660, 1700_D, 580_B).
- B. PE reads connecting ERG and SLC45A3 for sample 2621_D. The outer circle reports all chromosomes, whereas the inset shows only the region of ERG and SLC45A3. The gray lines depict the intra-transcript PE reads, whereas the red ones represent the inter-transcript PE reads. Note that for illustration purposes, only the inter-transcript reads are shown for SLC45A3. The inset also depicts the composite model (blue line) and its exons (green boxes).
- C. Results of the junction-sequence identifier. The location of the breakpoints for the 4 samples with the TMPRSS2-ERG fusion are reported as bars (not to scale). Moreover, the sequence of the junctions as well as a subset of the aligned reads for 2 samples is reported (106_T, 580_B).
- D. The locations of the PCR primers used for the validation are depicted as red arrows. The isoforms consist of TMPRSS2 and ERG exons fused to form different exon combinations as depicted schematically. For both samples NCI-H660 and 1700_D, isoform III is detected, whereas, for samples 106_T and 580_B, isoforms I and VI are determined, respectively. The transcript isoforms were validated by a PCR assay for each sample separately (gel images). A 50 bp length standard (lane 1) is shown here for the determination of the approximate fragment size. The identity of the PCR products was validated by Sanger sequencing.


