FusionSeq List of programs
From GersteinInfo
(→gfrConfidenceValues) |
(→gfrConfidenceValues) |
||
| Line 229: | Line 229: | ||
gfrConfidenceValues computes the scores SPER, DASPER, and RESPER for each candidate. SPER is the number of '''S'''upportive '''PE R'''eads per candidates, i.e. the normalized number of inter-transcript reads. | gfrConfidenceValues computes the scores SPER, DASPER, and RESPER for each candidate. SPER is the number of '''S'''upportive '''PE R'''eads per candidates, i.e. the normalized number of inter-transcript reads. | ||
| - | <math>SPER = \frac {m} {N_{mapped}}*10^6</math> | + | <math>SPER=\frac {m}{N_{mapped}}*10^6</math> |
| - | DASPER ('''D'''ifference between the observed and the '''A'''nalytically computed '''SPER''') and RESPER ('''R'''atio between the observed SPER and the '''E'''mpirically computed '''SPER''') compare the observed SPER with two slightly different ways to compute the expectation. Please find at [http://genomebiology.com/2010/11/10/R104/abstract Genome Biology, 2010;11:R104] more information about those scores. | + | where <math>m</math> is the number of inter-transcript reads, i.e. PE-reads connecting two different genes. |
| + | |||
| + | DASPER ('''D'''ifference between the observed and the '''A'''nalytically computed '''SPER''') and RESPER ('''R'''atio between the observed SPER and the '''E'''mpirically computed '''SPER''') compare the observed SPER with two slightly different ways to compute the expectation. | ||
| + | Please find at [http://genomebiology.com/2010/11/10/R104/abstract Genome Biology, 2010;11:R104] more information about those scores. | ||
'''Usage''': | '''Usage''': | ||
Revision as of 18:08, 27 October 2010
User documentation main
Contents
|
Data formats
FusionSeq use a few data formats to perform its operations.
Mapped Read Format (MRF)
This format is defined in the context of RSEQtools. More details can be found here.
Gene Fusion Report (GFR)
This file format defines the relevant information for each fusion transcript candidate. The rationale is that different filters can be applied to exclude “false positives” artificial fusions starting from an initial set. We also provide a parser that interprets this format allowing the user to propagate easily any changes to this format. For a given fusion candidate, involving gene A and gene B, the basic GFR format requires the following fields:
- ID: the ID of the fusion candidate: typically it contains the sample name and a unique number separated by an underscore. The number is padded with zeros for consistency;
- SPER, DASPER and RESPER: scoring of the fusion candidate;
- Number of inter-transcript reads, i.e. the number of pairs having the ends mapped to the two genes;
- P-value of the insert size distribution analysis for the fusion transcript. Since we do not know the actual composition of the fusion transcript, we computed the p-value for both directions: AB (where gene A is upstream of gene B) and BA (where gene B is upstream of gene A);
- Number of intra-transcript reads for gene A and gene B, respectively, i.e the number of pairs where both ends map to the same gene;
- The type of the fusion: cis, when both genes are on the same chromosome, or trans, otherwise;
- Name(s) of the transcripts: all the UCSC gene IDs of the isoforms of each gene in the annotation separated by the pipe symbol '|';
- Chromosome of the genes;
- Strand information;
- Start and end coordinates of the longest transcript for both genes;
- Number of exons in the composite model for both genes;
- Coordinates of the exons in the composite model: each exon is separated by the pipe symbol '|' and start and end coordinates are comma-separated;
- Exon-pair count: it describes which exons are connected and the number of inter-reads;
- Inter-reads: the exon and the coordinates of the reads that join the two genes. Exon number, start and end coordinates are reported as comma-separated, with the pipe symbol '|' separating the different pairs;
- Reads of the transcripts: the actual sequence of all the inter-reads.
The GFR format can include additional optional information computed in the subsequent processing. For example, it is possible to add gene symbols and descriptions from the UCSC knownGene annotation set.
Breakpoint data format (BP)
Similarly to GFR, the junction-sequence identifier uses a standard format to capture the results of this analysis. For each tile that has at least 1 read aligned to, it reports, comma-separated:
- chromosome, start and end coordinates of the first tile, using UCSC notation: “chr:start-end”, although the intervals are 1-based and closed;
- chromosome, start and end coordinates of the second tile
- All the sequences of the reads mapped to that tile with the offset information, separated by the pipe symbol.
For example, one line may read as:
chr21:38764851-38764892,chr21:41758661-41758702,31:GTAGAATCATTCATTTCATTCTTGCAAACCAGCCTGCTTGGCCAGGAGGCA|30:TGTAGAATCATTCATTTCATTCTTGCAAACCAGCCTGCTTGGCCAGGAGGC
where two reads support this specific junction.
Core programs
Fusion detection module
geneFusions
geneFusions identifies potential fusion transcript candidates from an alignment file.
Usage:
geneFusions prefix minNumberOfReads < sample.mrf > fusions.gfr
- Inputs: Takes an MRF file from STDIN
- Outputs: Reports GFR to STDOUT
- Required arguments
- prefix - the main ID of each candidate, i.e. prefix_0001, prefix_0002, etc.
- minNumberOfReads - the minimum number of reads required to include a candiate
- Optional arguments
- none
Filtration cascade module
Mis-alignment filters
gfrLargeScaleHomologyFilter
It removes potential fusion transcript candidates if the two genes are paralogs. It uses TreeFam to establish is two genes have similar sequences.
Usage:
gfrLargeScaleHomologyFilter < fileIN.gfr > fileOUT.gfr
gfrSmallScaleHomologyFilter
It removes candidates that have high-similarity between small regions within the two genes, where the reads actually map.
Usage:
gfrSmallScaleHomologyFilter < fileIN.gfr > fileOUT.gfr
gfrRepeatMaskerFilter
Some reads may be aligned to repetitive regions in the genome, due to the low sequence complexity of those regions and may result in artificial fusion candidates. This filter removes reads mapped to those regions. If the number of reads left if less than a threshold, the candidate is removed.
Usage:
gfrRepeatMaskerFilter repeatMasker.interval minNumberOfReads < fileIN.gfr > fileOUT.gfr
- Inputs: GFR from STDIN
- Outputs: Reports GFR to STDOUT
- Required arguments
- repeatMasker.interval - the interval file with the coordinates of the repetitive regions
- minNumberOfRead - minimum number of reads overlapping the repetitive regions in order to remove the candidate
Random pairing of transcript fragments
gfrAbnormalInsertSizeFilter
gfrAbnormalInsertSizeFilter removes candidates with an insert-size bigger than the normal insert-size. The fusion candidate insert-size is computed on the minimal fusion transcript fragment.
Usage:
gfrAbnormalInsertSizeFilter pvalueCutOff < fileIN.gfr > fileOUT.gfr
- Inputs: GFR from STDIN
- Outputs: Reports GFR to STDOUT
- Required arguments
- pvalueCutOff - the p-value threshold above which we keep the fusion transcript candidates
Combination of mis-alignment and random pairing
gfrRibosomalFilter
gfrRibosomalFilter removes candidates that have similarity with ribosomal genes. The rationale is that reads coming from highly expressed genes, such as ribosomal genes, are more likely to be mis-aligned and assigned to a different genes.
Usage:
gfrRibosomalFilter < fileIN.gfr > fileOUT.gfr
gfrExpressionConsistency
It removes candidates that do not have reads aligned to the corresponding genes.
Usage:
gfrExpressionConsistency < fileIN.gfr > fileOUT.gfr
Other filters
gfrPCRFilter
gfrPCRFilter removes candidates with the same read over-represented, yielding to a “spike-in-like” signal, i.e. a narrow signal with a high peak.
Usage:
gfrPCRFilter offsetCutoff minNumUniqueRead
- Inputs: GFR from STDIN
- Outputs: Reports GFR to STDOUT
- Required arguments
- offsetCutoff - the minimum number of different starting positions
- minNumUniqueRead - the minimum number of unique reads required to include a candidate
gfrAnnotationConsistencyFilter
It removes candidates involving genes with specific description, such as ribosomal, pseudogenes, etc.
Usage:
gfrAnnotationConsistencyFilter string < fileIN.gfr > fileOUT.gfr
- Inputs: GFR from STDIN
- Outputs: Reports GFR to STDOUT
- Required arguments
- string - a string identifying the element to remove, ex. pseudogene
gfrProximityFilter
It removes candidates that are likely due to mis-annotation of the 5' or 3' ends of the genes.
Usage:
gfrProximityFilter offset < fileIN.gfr > fileOUT.gfr
- Inputs: GFR from STDIN
- Outputs: Reports GFR to STDOUT
- Required arguments
- offset - the minimum distance (in nucleotides) between the two genes to keep the candidate
gfrBlackListFilter
It removes candidates specified by the user in a file
Usage:
gfrBlackListFilter blackList.txt < fileIN.gfr > fileOUT.gfr
- Inputs: GFR from STDIN
- Outputs: Reports GFR to STDOUT
- Required arguments
- blackList.txt - the file with the candidates to remove. The format of this files is a simple two-column tab-delimited file with describing the two gene symbols. For example:
LOC388160	LOC388161
LOC388161	LOC388161
LOC440498	LOC440498
gfrSpliceJunctionFilter
It removes candidates if the reads can be aligned to a splice junction library. NB: this filter should be used only if the alignment was not performed against a splice junction library.
Usage:
gfrSpliceJunctionFilter splice_junction_library < fileIN.gfr > fileOUT.gfr
- Inputs: GFR from STDIN
- Outputs: Reports GFR to STDOUT
- Required arguments
- splice_junction_library - the splice_junction_library in 2bit format
Scoring the candidates
gfrConfidenceValues
gfrConfidenceValues computes the scores SPER, DASPER, and RESPER for each candidate. SPER is the number of Supportive PE Reads per candidates, i.e. the normalized number of inter-transcript reads.
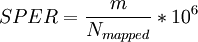
where m is the number of inter-transcript reads, i.e. PE-reads connecting two different genes.
DASPER (Difference between the observed and the Analytically computed SPER) and RESPER (Ratio between the observed SPER and the Empirically computed SPER) compare the observed SPER with two slightly different ways to compute the expectation. Please find at Genome Biology, 2010;11:R104 more information about those scores.
Usage:
gfrConfidenceValues prefix
- Input: GFR from STDIN
- Output: Reports GFR to STDOUT
- Required arguments
- prefix - the prefix of the .meta file
Note: gfrConfidenceValues expects that the file prefix.meta is available. This file includes some meta information about the MRF dataset. The minimum required set of information is the number of mapped reads with the following syntax as an example:
Mapped_reads 236549456
This represent the number of PE reads that were mapped. It is possible to determine this number by counting the number of lines in the MRF file. For example:
grep -v AlignmentBlocks file.mrf | wc -l
gfrConfidenceValueTranscript [deprecated]
gfrConfidenceValueTranscript computes LSPER (Local SPER) as the number of inter-transcript PE reads supporting the fusion divided by the average gene expression value. However, since in many cases, only one allele contributes to the fusion transcript, the expression of the fusion transcript may not correlate with the expression of the genes generating it. Please find at Genome Biology 2010;11:R104 more details about why this score may impair the correct ranking of the candidates (see Additional file 1, text and Figure S6).
Usage:
gfrConfidenceValueTranscript prefix
- Input: GFR from STDIN
- Output: Reports GFR to STDOUT
- Required arguments
- prefix - the prefix of the .composite.expression file
Note: gfrConfidenceValueTranscript expects that the file prefix.composite.expression is available. This file includes the expression values for the genes that are part of the transcript. The best way to compute is by using RSEQtools, using mrfQuantifier, e.g.:
mrfQuantifier knownGeneTranscriptCompositeModel.txt multipleOverlap < prefix.mrf > prefix.composite.expression
where knowGeneTranscriptCompositeModel.txt is the interval file representing the UCSC knownGenes library.
Junction-sequence identification module
gfr2bpJunctions
It generates the splice junction library and two files to be run with a cluster to perform the indexing and the mapping in parallel.
Usage:
gfr2bpJunctions <file.gfr> <tileSize> <sizeFlankingRegion> [minDASPER]
- Input: file.gfr - GFR file (not from STDIN)
- Outputs: Two files with all the jobs to be run on a cluster:
- file_joblist1.txt: the instructions to index the library and align the reads to the junction library.
- file_joblist2.txt: the instructions to aggregate the results of the alignment.
- Required parameters:
- tileSize: the number of nucleotides in each tile. For example, a 50nt read may be aligned to a 80nt junction, thus tileSize would be 40.
- sizeFlankingRegions: the size, in nucleotides, of the flanking region around the exons.
- Optional parameters:
- minDASPER: the minimum DASPER values for which the breakpoint analysis is performed.
validateBpJunctions
It validates the junctions, i.e. excludes those junctions with sequence similarity to the other regions of the genome.
Usage:
validateBpJunctions < fileIN.bp > fileOUT.bp
bpFilter
It filters some of the junctions because of number of reasons (see parameters).
Usage:
bpFilter <minNumReads> <minNumUniqueOffsets> <minNumReadsForKS> <pValueCutoffForKS> <numPossibleOffsets>
- Input: BP file from STDIN
- Output: BP file to STDOUT
- Required parameters
- minNumReads: minimum number of reads aligned to the junction to be kept
- minNumUniqueOffsets: minimum number of unique reads aligned to the junction to avoid PCR artifacts
- minNumReadsForKS: minimum number of reads to perform a Kolmogorov-Smirnov (KS) test. This would compare the reads distribution with a uniform one. However, only if there are sufficient reads this test can be performed.
- pValueCutoffForKS: the pvalue cut-off if a KS test is used
- numPossibleOffsets: number of possible offsets, i.e. starting positions of the reads
bp2wig
It generates a signal track from the reads aligned to the junction.
Usage:
bp2wig file.bp
- Input: BP file (not from STIDIN)
- Output: WIGGLE files showing the support of the junction
bp2alignment
It generates a text representation of the reads aligned to the junction.
Usage:
bp2alignment
- Input: BP file from STDIN
- Output: an text file to STDOUT reporting the aligned read to the junction. For example:
Tile 1: chr21:38717312-38717353
Tile 2: chr21:41801877-41801918
Number of reads spanning breakpoint: 5


                               AGGAGGGTTC  CTGCCGCGCTCCAGGCGGCGCTCCCCGCCCCTCGCCCTCCG
                        ATTCATCAGGAGAGTTC  CTACCGCGCTCCAGGCGGCGCTCCCCGCCCCTCG
               CCACACTGCATTCATCAGGAGAGTTC  CTGCCGCGCTCCAGGCGGCGCTCCC
 CTTCCCGCCTTCGGCCACACTGCATTCATCAGGAGAGTTC  CTGCCGCGCTC
 CTTCCCGCCTTCGGCCACACTGCATTCATCAGGAGAGTTC  CTGCCGCGCTC
TCTTCCCGCCTTTGGCCACACTGCATTCATCAGGAGAGTTC  CTGCCGCGCTCCAGGCGGCGCTCCCCGCCCCTCGCCCTCCG
bowtie2bp
Utility for debugging. It converts the alignment to the fusion junction library from bowtie output to BP.
Usage:
bowtie2bp
- Input: bowtie alignment file from STDIN
- Output: BP file to STDOUT.
Auxiliary modules
gfr2images
It generates a schematic illustration depicting which regions of the two genes are connected by PE reads.
Usage:
gfr2images < fileIN.gfr
- Inputs: GFR from STDIN
- Outputs: JPEG images labeled SampleID_0000#.jpg, where SampleID is the unique identification of the fusion candidate present in the GFR file.
gfr2fasta
It generates two fasta files, one for each gene, with the PE-reads connecting them
Usage:
gfr2fasta < fileIN.gfr
- Inputs: GFR from STDIN
- Outputs: * Outputs: FASTA files labeled SampleID_0000#_[1|2].fasta, where SampleID is the unique identification of the fusion candidate present in the GFR file and [1|2] indicates which gene they correspond to.
gfr2bed
It generates two BED files of the fusion transcript reads; one per gene.
Usage:
gfr2bed < fileIN.gfr
- Inputs: GFR from STDIN
- Outputs: BED files labeled SampleID_0000#_[1|2].bed, where SampleID is the unique identification of the fusion candidate present in the GFR file and [1|2] indicates which gene they correspond to.
gfr2gff
It generates a GFF file for all candidates on the same chromosome reporting all PE-reads for visualization in genome browsers such as UCSC.
Usage:
gfr2gff < fileIN.gfr
- Inputs: GFR from STDIN
- Outputs: GFF files labeled SampleID_0000#.gff, where SampleID is the unique identification of the fusion candidate present in the GFR file.
export2mrf
It generates an MRF file from the export files of a Genome Analyzer II run. Usage:
export2mrf prefix file_1_export.txt file_2_export.txt > file.mrf
- Inputs:
- prefix: the sample ID
- file_1_export.txt: the export file for the first end
- file_2_export.txt: the export file for the second end
- Outputs:
- An MRF file with all the mapped reads to STDOUT
- prefix_allReads.txt: the list of all the reads for the breakpoint analysis. Each line reports only a read
